Bitcoin (BTC) continues to face strong resistance at its 50-day moving average, currently at $34,000.
The cryptocurrency has been stuck at the $30,000 price level for the past two weeks, absorbing much of the trading volume. This could indicate volatile price action later this month.
On the daily chart, Bitcoin's Relative Strength Index (RSI) is below the neutral level of 50, indicating a weakening momentum behind the recent price upswing. The continued decline in momentum means that BTC's six-month downtrend remains intact.
The weekly RSI is more oversold than it has been since March 2020, when the price was in an uptrend. This time, however, the uptrend seems to be limited due to negative long-term momentum signals.
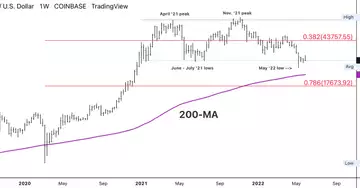
In the short term, however, BTC could stabilize above the support zone between $20,000 and $25,000. The 200-week moving average, currently at $22,179, is another indicator of long-term trend support.
The DeMark indicators show a bullish signal for BTC that could occur in the next two weeks. This could pave the way for a short-term price rally that would delay further breakthroughs on the chart. Upsides could be short-lived, however, as secondary support at $17,673 provides a more stable floor for capitulation.

